
Comparisons
Comparisons tool offers an efficient way to do peer group analysis. User can compare the key figures of any group of companies in the system with tools such as scatters and rankings-lists. Comparisons can be made within industry, or inside a group of companies selected by the user.
Key features of Comparisons Pages
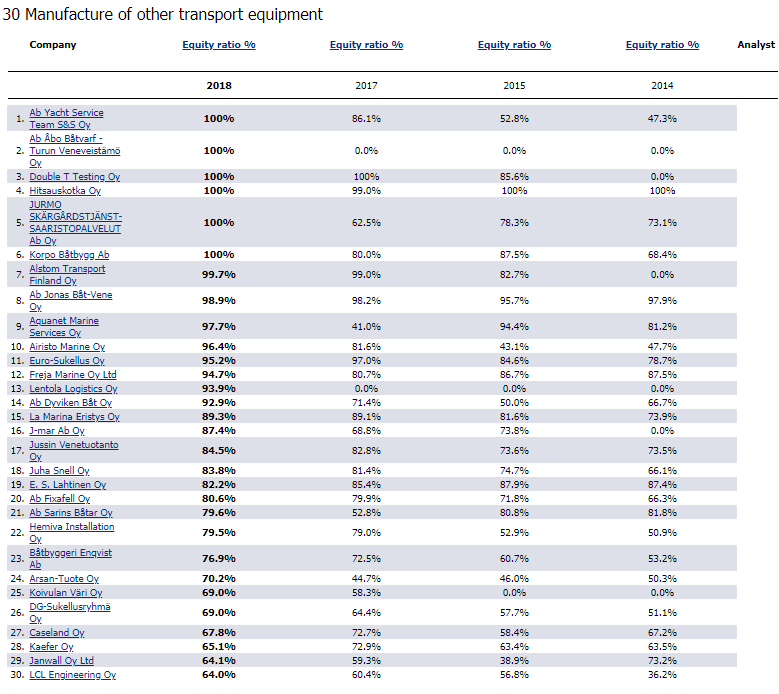
Comparisons using rankings-lists
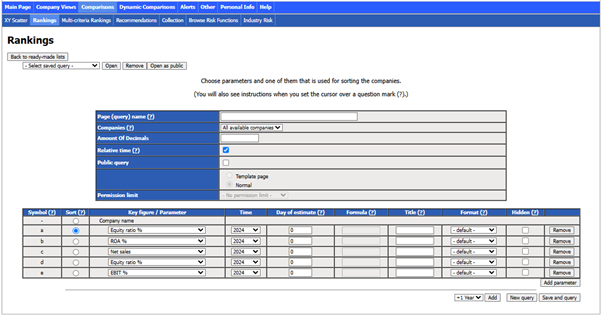
- User can create Comparisons-list by choosing the industry or ready-made company list and selecting parameters.
- Parameters include key figures, like Net sales, Equity ratio-%, ROA-%, etc.
- By applying changes, the system will create a list based on these criteria and user can rank and sort the companies, inspect them individually in our system or export the list.
- Lists can be saved and made public or private.
- Layout and content of the pages can be modified – choose the figures and graphs you want to use
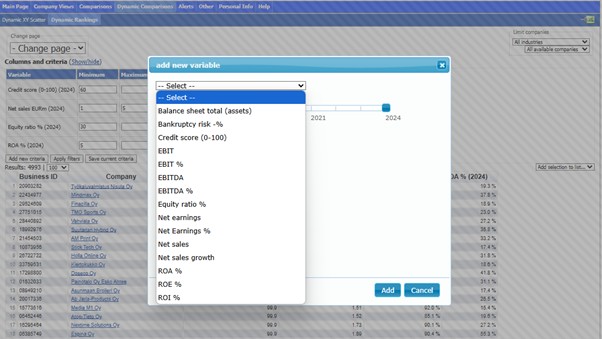
Picture below shows how ranking criteria can be changed.
Comparisons using XY-Scatters
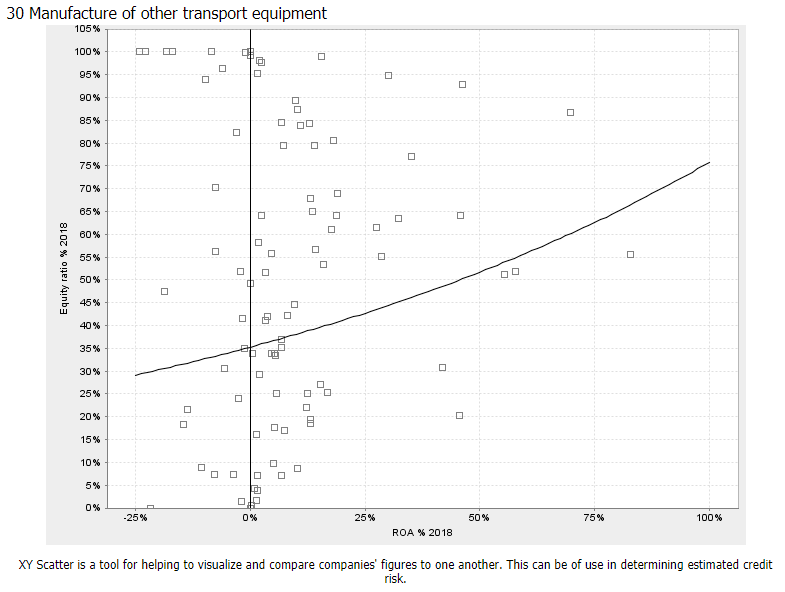
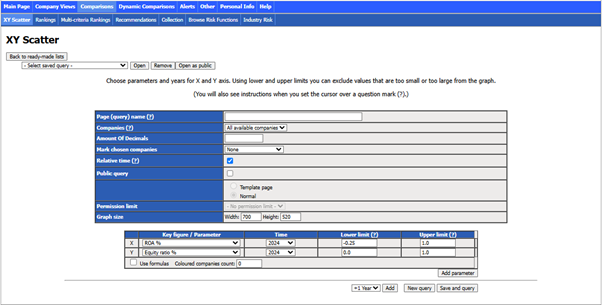
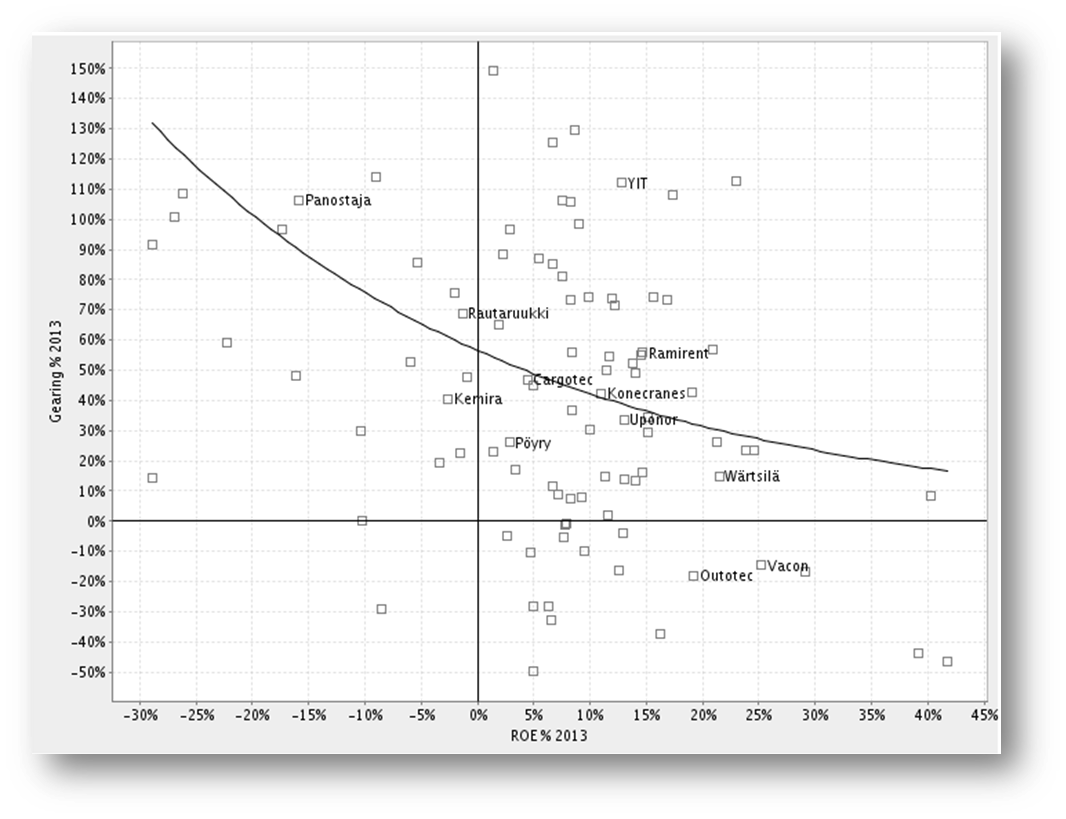
- In XY-scatter -tool, user can create lists by choosing industry or ready-made company list and selecting parameters and limits for the parameters for a specific year.
- The comparison can be done within an industry or inside a peer group defined by the user
- Every point in the scatter is linked to the company views page of the company in question
The criteria is edited the same way it is edited ranking lists.
Own company lists
- It is easy to select a list of companies and compare them to another group of companies (e.g. to a chosen industry) in xy-scatter
- Scatter is an illustrative tool to compare financial conditions of companies to a peer group in graphical form
Dynamic comparisons
Dynamic rankings overview
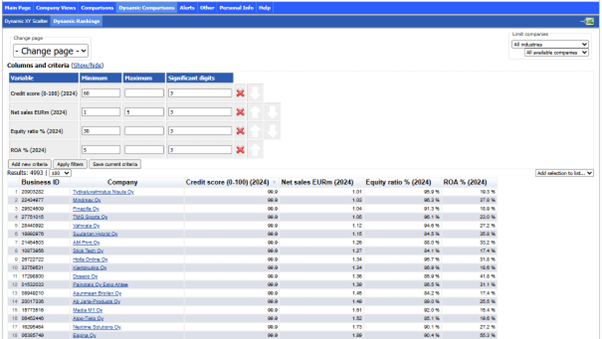
Using our Dynamic Rankings, you can screen companies using multiple criteria. You may select any of the available variables from any year and define both minimum and maximum values for them. You can also sort the list according to each variable and limit the companies by industries.
Below is an image of the page with a ready-made list ‘Demo’ that filters companies by their Net sales, Credit score, Equity ratio and ROA %.
Dynamic XY-scatter overview
This page is essentially the same as the Dynamic Rankings, but it also contains a scatter graph in addition to the list of companies. On this page, you can plot companies onto a scatter graph according to variables and value ranges of your choosing. For a scatter graph to be drawn, you need to add two criteria. You can add more if you like, and the additional variable values will be shown in the list but naturally not in the scatter graph.
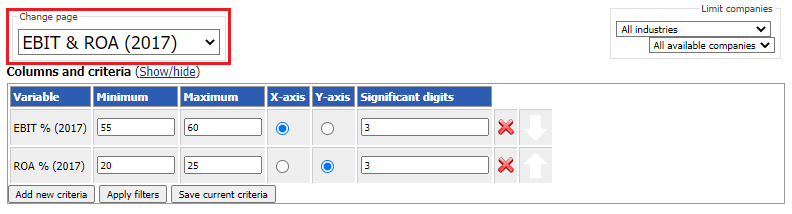
As a result you get a XY scatter containing companies fulfilling your criteria. You can view the values of the selected variables of a company by hovering over the dot of the wanted company on the graph. You can go to the company’s page by clicking the dot or by clicking the company’s name in the list.
Below is an image showing how the companies can be viewed from the scatter.
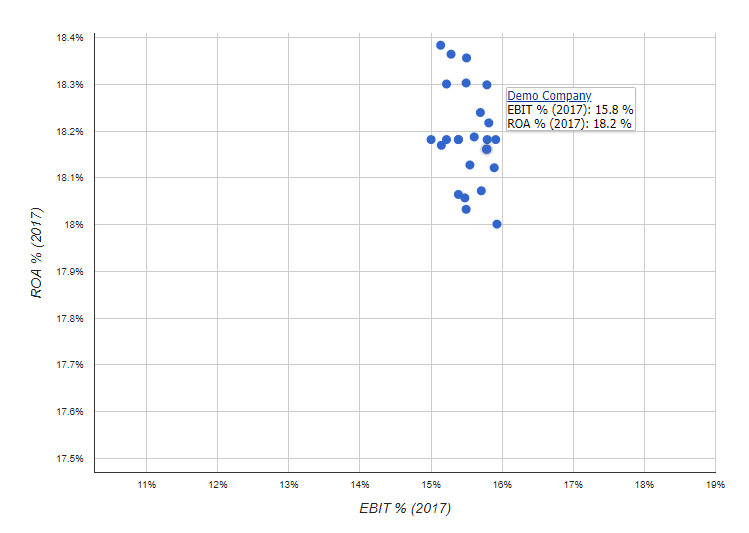
You can also move around in the graph. You can zoom in and out of the graph by hovering your mouse over the graph and scrolling (down for zooming in and up for zooming out). You can also drag the graph around to view different parts of it.
For more information about comparison tool read the user manual.